§ Free tool
Website speed test & revenue check.
This website speed test runs your page through Google PageSpeed Insights and shows the three Core Web Vitals Google uses for ranking: LCP, INP and CLS. Add your traffic and conversion figures to see an estimate of the revenue a slow page may be costing you.
What the scores mean
Largest Contentful Paint (LCP) is how long the main content takes to appear; Google's target is 2.5 seconds or less. Interaction to Next Paint (INP) is how quickly the page responds to a tap or click; the target is 200 milliseconds. Cumulative Layout Shift (CLS) measures how much the layout jumps while loading; the target is 0.1.
Where Google has enough real visitor data for your page, the test shows it (field data, what your visitors actually experience). Otherwise it shows a lab test of a single load on a mid-range phone.
How the revenue estimate works
Studies of retail and lead-generation sites, including Deloitte's Milliseconds Make Millions, found conversions rise measurably as pages get faster. The estimate applies a deliberately conservative version of that effect to the part of your load time above Google's 2.5-second target.
Treat it as a sense of scale, not a forecast. The way to know your own number is to speed a page up and compare conversion rates before and after.
What a good result looks like
The headline number is Google's performance score out of 100: 90 or more is good, 50 to 89 needs work and under 50 is poor. It comes from a single lab run, so it can move a few points between tests. Each Core Web Vital gets its own rating too. LCP over 4 seconds, INP over 500 milliseconds or CLS over 0.25 counts as poor.
Below the vitals, the website speed test shows First Contentful Paint and Total Blocking Time from the lab run, and the biggest savings Google found, such as unused JavaScript or images larger than they need to be. INP needs real visits to measure, so when Google has no field data for a page, Total Blocking Time is the closest stand-in for how responsive it feels.
The most common problems we find
A slow LCP is nearly always the hero image or slider: a large file, served at full desktop size to phones, and loaded late or lazy-loaded when it should load first. Web fonts that hold back the text and a slow server response come next, especially on budget shared hosting or pages built with heavy page builders.
Poor INP usually comes from too much JavaScript: chat widgets, tracking pixels, consent banners and testing scripts all competing for the browser's attention at once. Layout shift comes from images and embeds without a set width and height, and from cookie or promotion bars that push the page down after it has started to appear.
What to fix first
Fix any metric rated poor before chasing the score. For LCP, resize and compress the main image, serve it as WebP or AVIF, preload it and stop lazy-loading anything at the top of the page. For INP, remove or delay scripts that do not need to run on every page. For CLS, give every image and embed its dimensions and reserve space for banners.
Then test again on mobile, where most sites score lowest. If the lab score improves but the field data does not move yet, give it time: Google's real-visitor data covers the previous 28 days, so a fix can take up to four weeks to show fully in your Core Web Vitals. Retest key templates such as product and blog pages, not just the home page.
How we can help
Wyrelane Solutions is an experienced team that builds and fixes this for clients in the US, UK, Europe and Australia, at fixed prices with weekly demos:
- Website Speed Optimization Website speed optimization services for WordPress, Shopify and custom sites: we fix Core Web Vitals, images, code, caching and hosting for rankings and sales.
- SEO & Technical Optimization Technical SEO services: audits, structured data, Core Web Vitals, indexing fixes and on-page optimization that help your site rank higher on Google.
Frequently asked questions
Is this website speed test free?
Yes. It uses Google's free PageSpeed Insights data. There is a small limit on tests per minute so the service stays available for everyone.
What is a good Core Web Vitals score?
Google's targets are LCP of 2.5 seconds or less, INP of 200 milliseconds or less and CLS of 0.1 or less, measured on real visits.
What is a good PageSpeed score?
90 to 100 is good, 50 to 89 needs work and below 50 is poor. On mobile, a score in the 70s or 80s is respectable if your Core Web Vitals pass. Google ranks pages with the real-visitor Core Web Vitals, not the lab score itself.
Why does my PageSpeed score change every time I test?
The lab test is a single page load, and network timing, server load and third-party scripts vary between runs, so a swing of a few points is normal. This tool keeps each result for an hour per page and device, so testing again straight away shows the same numbers.
Does page speed affect SEO?
Yes, as one signal among many. Core Web Vitals are part of how Google judges page experience, which mostly decides between pages of similar relevance. The bigger effect is usually on visitors: slow pages lose people before they read, sign up or buy.
Why is my mobile score lower than desktop?
The mobile test simulates a mid-range phone on a slower connection, which is how many visitors arrive. Most sites score lower on mobile, and that is the score that matters most.
Can you fix a slow website without a redesign?
Usually, yes. Most gains come from images, fonts, scripts, caching and hosting, which can be fixed without changing how the site looks.
Further reading
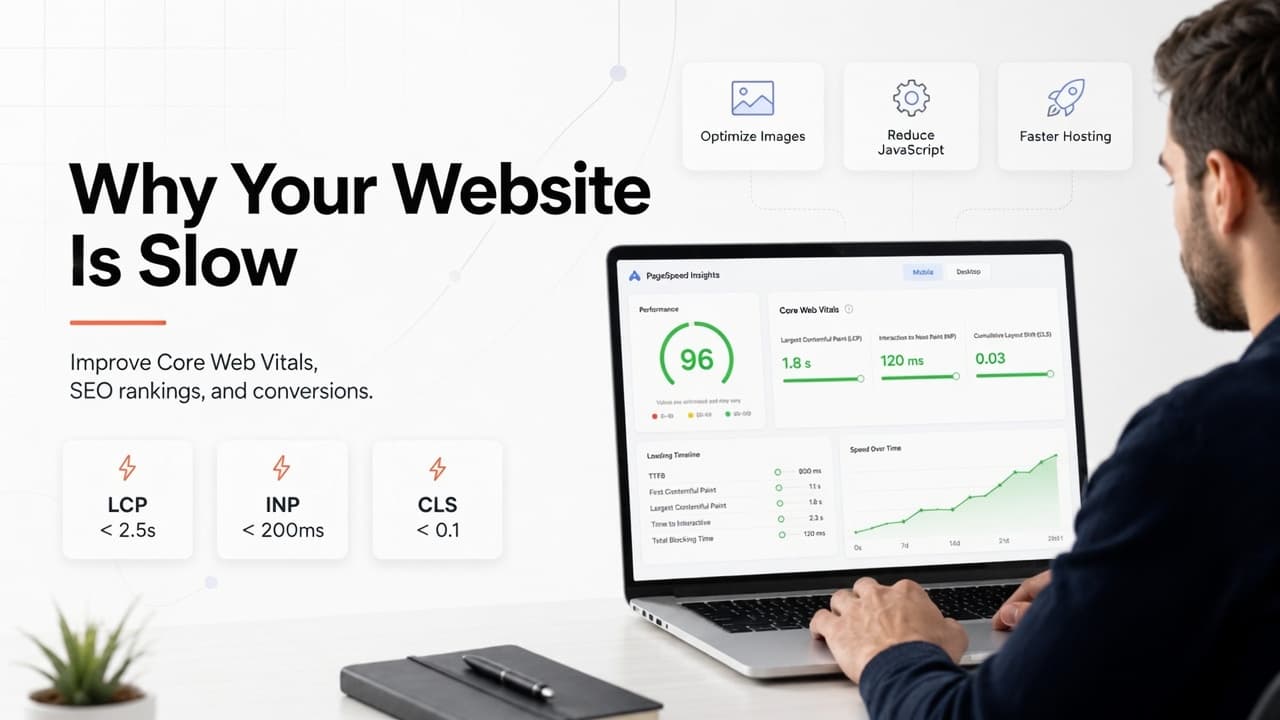
Why Is My Website Slow? Core Web Vitals, Rankings and How to Fix It
Why is your website slow? Find which Core Web Vital is failing (LCP, INP or CLS), trace it to the real cause, and fix that first, using Google's own thresholds.
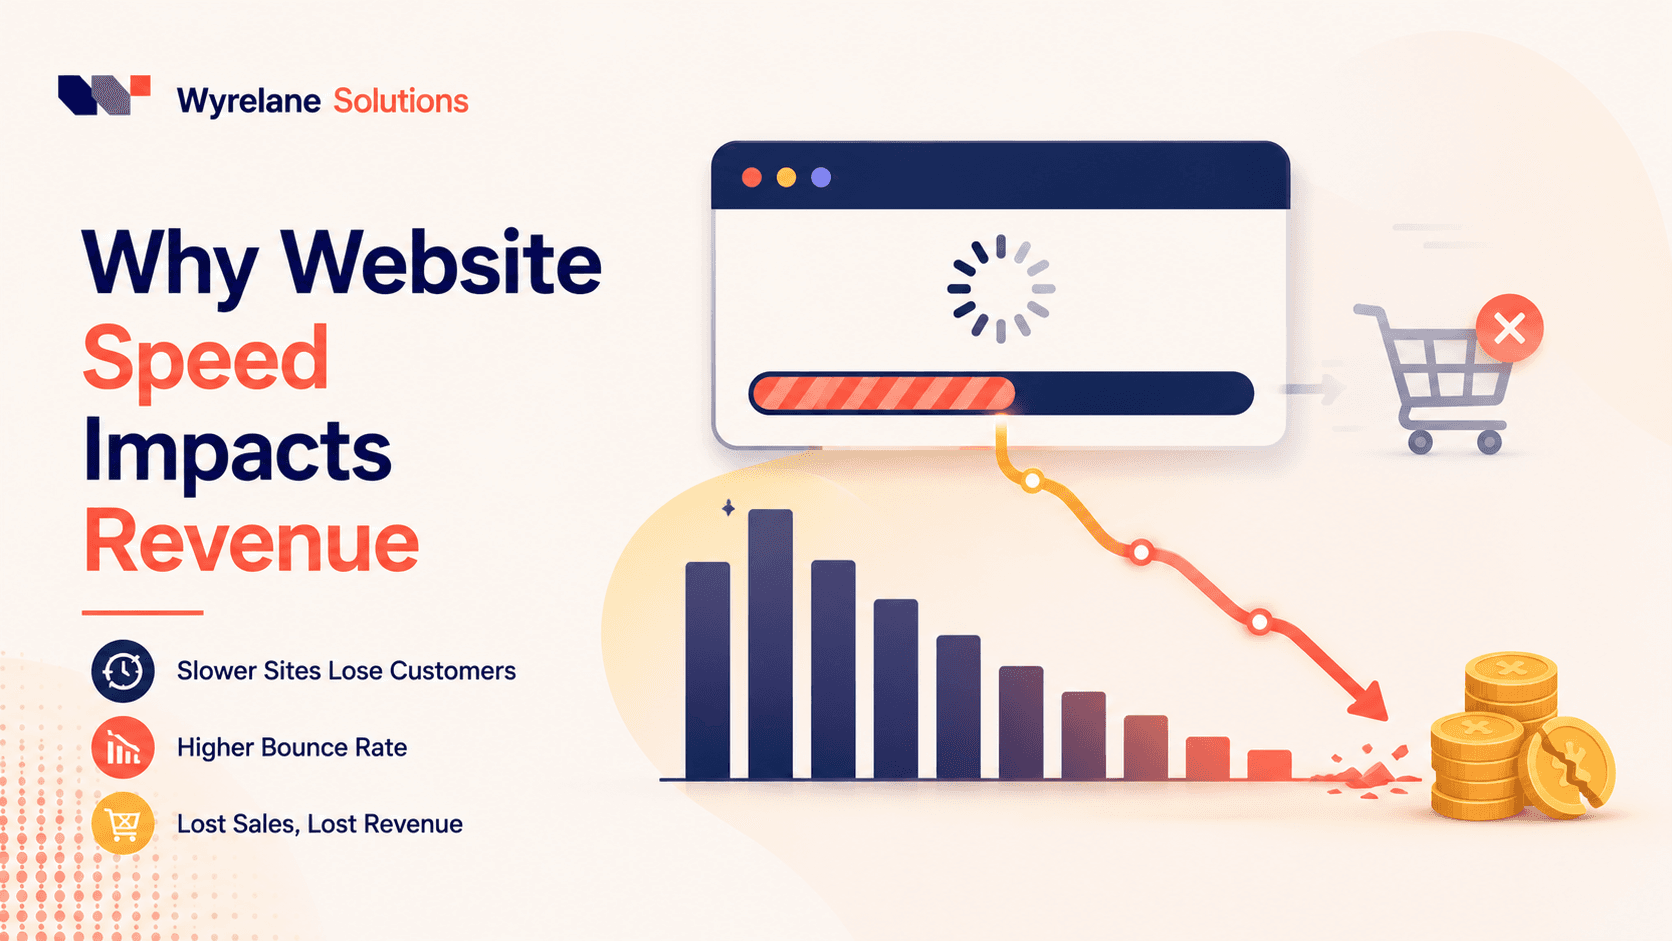
Website Speed and Revenue: What a Slow Site Really Costs You
How website speed turns into lost revenue through bounces, lower conversion, wasted ad spend and rankings, plus a simple formula to price it on your own numbers.